Call for Live Demonstrations
We are looking for participants to do a live demonstration of some visually-informed analysis of movement data using a tool or your choice. We hope that this will lead to useful knowledge exchange and discussion.
What you can use this for:
– demonstrate a technique or approach
– demonstrate a tool (perhaps that others can use)
– demonstrate how one might go about working with movement data
What we’d like:
– Visual, computational or (preferably) both.
– Gulls: We would encourage you to use the gulls data from the original data challenge, but you don’t have to. You can use whichever movement data you like.
– Focused: Please focus on some specific aspects of the data, technique or question.
– Interesting: It doesn’t have to be deep or novel, but it should be interesting and focussed. Show us how a technique leads to an interesting finding or helps overcome some analytical challenge.
– Live demo: It should be live and delivered within a 10 or 15 min slot.
Who’s invited:
This is open to all workshop attendees.
How to participate:
Please email vcma2016@city.ac.uk with a short title and short (<250 word) description of what you plan to show. Include the following:
– Technique/tool: what the technique or tool is
– Data: what the data are
– Analysis: what technique/tools is good for
– Applicability: how applicable the techniques/tools are across application domains. Please think about this as we hope to follow this up at the end.
For example:
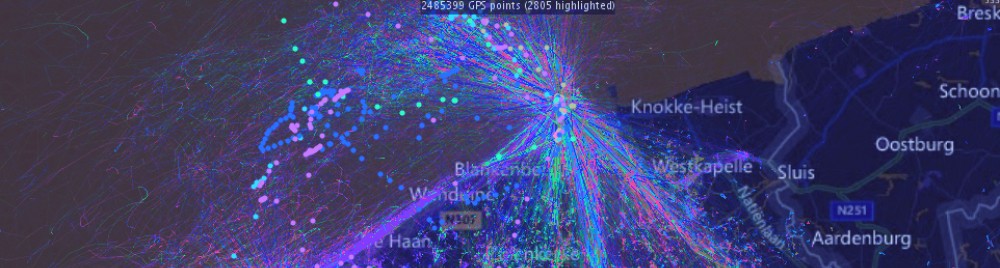
A tool for exploratory analysis of movement data (Aidan Slingsby)
I will demonstrate a tool for the exploratory analysis of bird movement data. This freely-available tool will be presented at EuroVis next month. I will do some live exploratory analysis on the Gulls Data Challenge data showing (a) how the tool corrects for irregularly sampled data, (b) how brushing in linked space-time views helps us find structure in the data and (c) some visualisation techniques that show how this structure varies geographically. I will show structures in the data and suggest what these mean and then reflect on the applicability to other domains.